Every project needs a schedule. Whether you are redesigning a website, opening a new branch, organizing an event or building a house, a schedule shows what must be done, who will do it, when each task starts and finishes, and how the tasks fit together. A visual timeline, or Gantt chart, makes the plan easy to understand at a glance and shows straight away when something is running late.
Our free project schedule template for Excel creates a Gantt chart automatically. Enter the project start date, then list tasks with an owner, a start offset or date and a duration in days. The template calculates end dates and fills the weekly timeline with coloured bars, using dark bars for completed tasks and light bars for planned work. The sample shows a 12-task website redesign in four phases. Preview it below and download the XLSX.
Download the free project schedule template
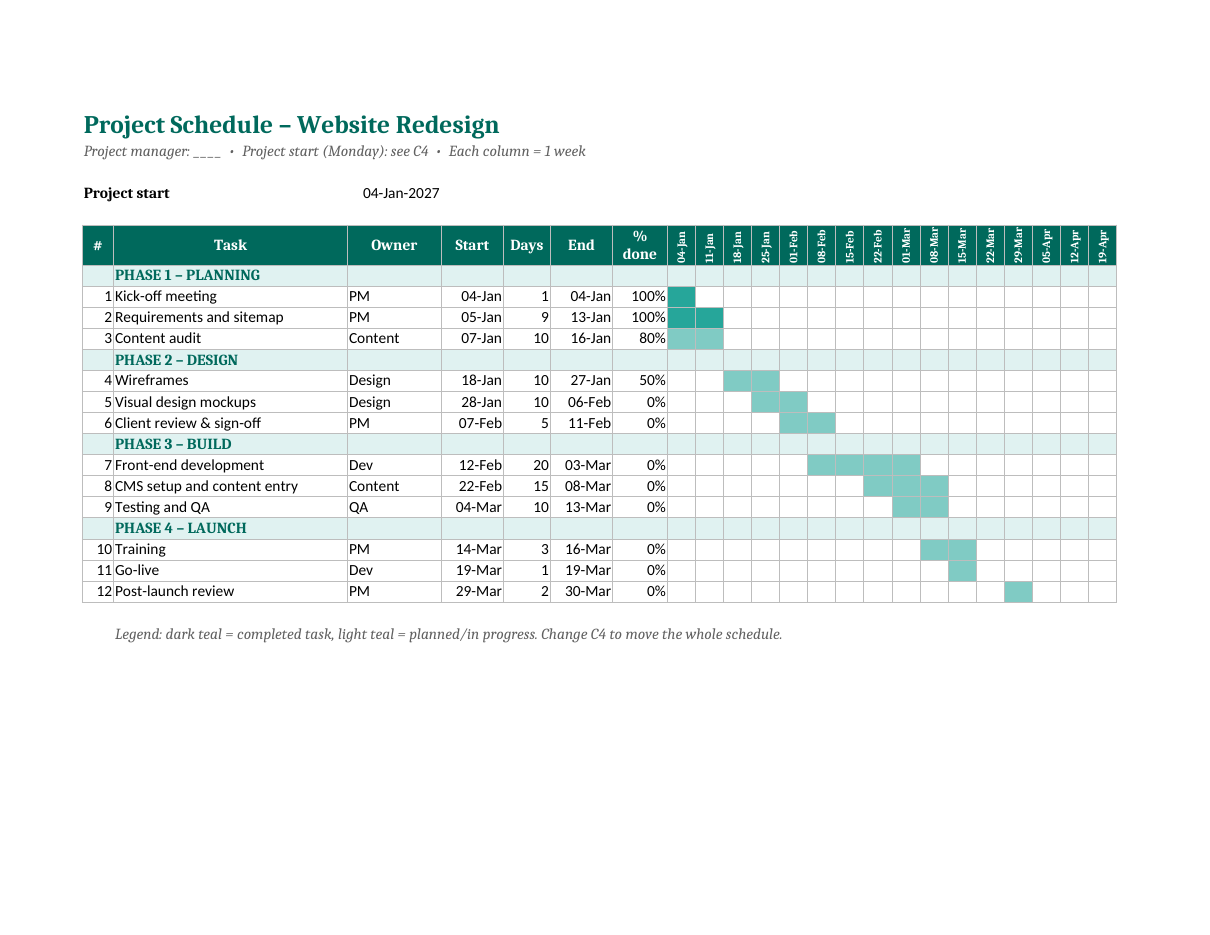
The spreadsheet works in Microsoft Excel, Google Sheets and LibreOffice Calc. Change the start date in cell C4 and the whole schedule and timeline move automatically.
What the template includes
- Project title, project manager and start date.
- Phases shown as shaded group rows.
- Task number, task name and owner.
- Start date, duration in days and automatic end date.
- Percent complete for each task.
- A 16-week timeline with week-commencing dates.
- Automatic Gantt bars using conditional formatting.
- Different colours for completed and planned tasks.
- A landscape layout that prints on one page.
How to use the project schedule
- Enter the project start date in cell C4, ideally a Monday.
- Replace the phase names with the main stages of your project.
- List the tasks under each phase in the order they will happen.
- Assign an owner to every task.
- Enter the start date for each task, or a formula based on the project start.
- Enter the duration in calendar days.
- Check the end dates and the Gantt bars.
- Adjust tasks that overlap too much or leave gaps.
- Update percent complete as work progresses.
- Share the printed schedule or PDF with the team every week.
How the Gantt chart works
Each column in the timeline represents one week, starting from the project start date. The template uses conditional formatting to colour a cell when the week overlaps the task's start and end dates. When percent complete reaches 100%, the bar turns dark teal; otherwise it stays light teal. Because everything is formula-based, you never need to colour cells by hand. If a task's start date or duration changes, the bar moves automatically.
Breaking a project into tasks
A good schedule starts with a good task list. Break the project into phases, such as planning, design, build and launch, then list the deliverables in each phase. Break each deliverable into tasks that one person or team can complete in a few days to two weeks. Tasks that are too large are hard to track; tasks that are too small make the schedule cluttered. Use a verb-noun name, such as "Write content" or "Test checkout", so everyone knows what the task involves.
Dependencies and the critical path
Many tasks cannot start until another finishes. For example, visual design depends on approved wireframes, and testing depends on development. In the sample, each task starts after the previous one in its chain. To link tasks with formulas, set a task's start date to the previous task's end date plus one day. The longest chain of dependent tasks is the critical path: if any task on it is late, the whole project finishes late. Watch these tasks most closely.
Estimating durations
- Ask the person doing the work how long it will take.
- Use past projects as a guide.
- Allow for weekends, holidays and other work.
- Add a buffer for review and approval tasks.
- Be careful with tasks that depend on outside parties, such as clients or suppliers.
- Review estimates after the first phase and adjust.
Keeping the schedule up to date
A schedule is only useful when it reflects reality. Hold a short weekly meeting to update percent complete, discuss delays and move dates if needed. Mark tasks as 100% only when they are fully finished. If a task slips, check which later tasks depend on it and update them. Save a copy of the original baseline schedule so you can compare planned and actual dates at the end of the project.
Planning a project for early 2027
Many organizations start new projects in January. If you prepare the schedule now, in November or December, you can agree resources, budgets and holidays before the new year begins. The sample website redesign starts on Monday 4 January 2027 and finishes with a post-launch review at the end of March, giving a clear quarter-long plan.
Who uses this template?
- Project managers and team leaders.
- Small business owners planning launches and moves.
- Event planners scheduling preparation tasks.
- Construction and renovation contractors.
- Marketing teams planning campaigns.
- Students managing group projects and dissertations.
Sample schedule walkthrough
The sample schedule plans a website redesign that starts on Monday 4 January 2027. The planning phase begins with a one-day kick-off meeting, followed by nine days of requirements and sitemap work and a ten-day content audit that overlaps with it. The design phase runs from mid-January to mid-February: wireframes, visual mockups and a five-day client review and sign-off. The build phase is the longest, with twenty days of front-end development, fifteen days of CMS setup and content entry, and ten days of testing. Finally, the launch phase includes training, a one-day go-live on 19 March and a post-launch review at the end of March.
The percent done column shows the project's status at the time of the snapshot. The first two tasks are complete, so their bars are dark teal. The content audit is 80% done and wireframes are 50% done, so they show as light teal. At a glance, a manager can see that the project is in its third week, the design phase is starting and the build phase is still ahead.
Customizing the template
- Change the colours of the phase rows and bars to match your company brand.
- Add a "Predecessor" column to record which task each task depends on.
- Add a "Status" column with values such as Not started, In progress, Done and Blocked.
- Add a milestone marker, such as a diamond symbol, for key dates like sign-off and go-live.
- Add a "Today" line using conditional formatting that highlights the current week.
- Hide the percent done column for a clean client-facing version.
Project schedule vs project log vs status report
These three documents work together. The schedule shows the plan: what will happen and when. A project log records what actually happened day by day, including decisions, problems and changes. A status report summarizes progress for managers and clients, usually weekly or monthly, and refers to the schedule to show whether the project is on track. Keeping all three up to date gives a complete picture of the project.
Tips for realistic schedules
Schedules often fail because they are too optimistic. People forget about holidays, sick days, approvals that take longer than expected and other work competing for the same people. Add buffer time before important deadlines, especially before a go-live date, and avoid scheduling the same person on several large tasks at the same time. When you share the schedule, explain which dates are firm and which are estimates.
Checklist before sharing the schedule
- Every task has an owner and a duration.
- Dependent tasks start after their predecessors finish.
- Holidays and known absences are allowed for.
- Key milestones and the go-live date are clearly visible.
- The team has reviewed and agreed the dates.
- A baseline copy has been saved.
- The print area shows the full timeline on one page.
Frequently asked questions
Is this project schedule template free?
Yes. Download, edit and use it for any project.
Can I add more weeks?
Yes. Copy the last timeline column to the right, and extend the conditional formatting range to include the new columns.
Can I use days instead of weeks?
Yes. Change the timeline header formula to add 1 instead of 7 for each column, and adjust the bar formula accordingly.
Does it work in Google Sheets?
Yes. Upload the file to Google Drive and open it with Google Sheets; the formulas and conditional formatting work there.
What is the difference between a project schedule and a project plan?
A project plan covers scope, budget, risks, communication and the schedule. The schedule is the part that shows tasks and dates.
How do I show milestones?
Add a task with a duration of 1 day and a name such as "Milestone: client sign-off". You can colour milestone rows differently or add a ◆ symbol.
Can I print the schedule on one page?
Yes. The print area is set to fit the full width on one landscape page. For longer projects, set it to fit on two pages wide or print on A3 paper.
Related templates
- Project log template
- Status report templates
- Action plan templates
- Weekly schedule templates
- Meeting agenda templates