Is your business actually making money? The profit and loss statement answers that question. Also called an income statement or P&L, it summarizes revenue, costs and expenses over a period and shows whether the business made a profit or a loss. Owners use it to track performance, lenders and investors use it to judge profitability, and tax authorities use it as the basis for income tax. A clear, well-organized P&L is one of the most useful financial tools any business can have.
Our free profit and loss statement template for Excel organizes a full year by quarter, with columns for Q1, Q2, Q3, Q4 and the full year, plus a percentage-of-revenue column that reveals your margins instantly. Gross profit, operating profit, profit before tax, income tax and net profit all calculate automatically. Preview the template below, download the XLSX file and follow our guide to prepare and understand your P&L.
Download the free profit and loss statement template
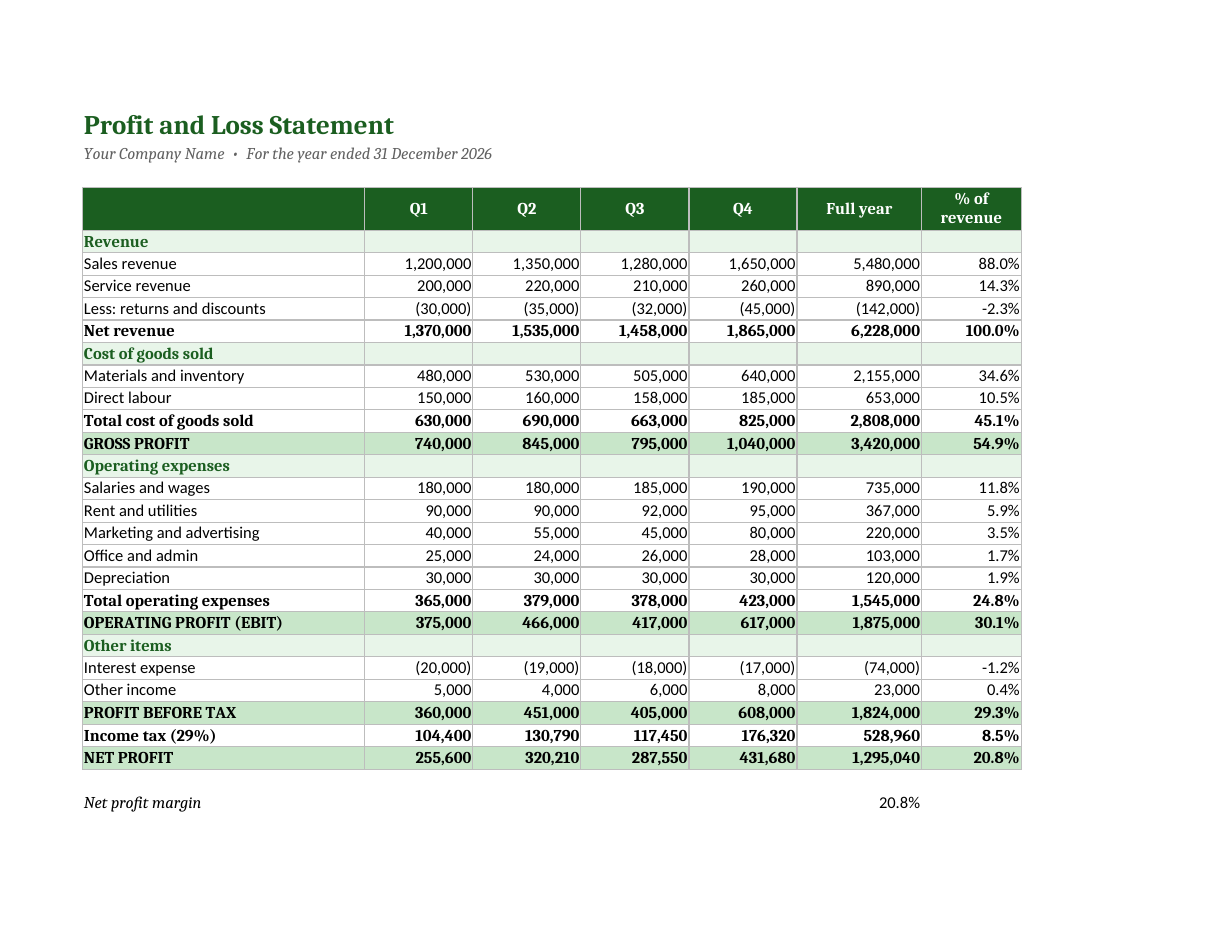
The spreadsheet works in Microsoft Excel, Google Sheets, LibreOffice Calc and Numbers. Enter your figures in the white input cells; every subtotal, total, margin and the net profit margin update automatically. The layout is set to landscape and fits on one printed page.
What is a profit and loss statement?
A profit and loss statement reports a business's financial performance over a period of time, such as a month, quarter or year. It starts with revenue at the top, subtracts the direct cost of producing goods or services to arrive at gross profit, then subtracts operating expenses to reach operating profit. After interest, other income and tax, the final line is net profit, often called the "bottom line". While the balance sheet shows what a business owns and owes at one moment, the P&L shows how it performed over time.
What the P&L template includes
- Company name and reporting period in the header.
- Quarterly columns for Q1 to Q4 and an automatic full-year total.
- Revenue section: sales revenue, service revenue and returns and discounts.
- Cost of goods sold: materials and inventory, plus direct labour.
- Automatic gross profit.
- Operating expenses: salaries, rent and utilities, marketing, office and administration, and depreciation.
- Operating profit (EBIT).
- Other items: interest expense and other income.
- Profit before tax, income tax at an editable rate and net profit.
- Percentage of net revenue for every line.
- Net profit margin summary.
How to prepare a profit and loss statement
- Choose the reporting period, such as the calendar year 2026 or your financial year.
- Enter the company name and period in the header.
- Gather sales records, invoices and bank statements for each quarter.
- Enter sales and service revenue, then returns and discounts as negative figures.
- Enter direct costs, such as materials, stock purchases and production wages, in cost of goods sold.
- Enter operating expenses from your bills, payroll and ledger.
- Record depreciation for equipment and other fixed assets.
- Enter interest paid on loans and any other income, such as interest received.
- Set the income tax rate that applies to your business.
- Review gross profit, operating profit and net profit for each quarter.
- Compare the percentage column with previous years or industry benchmarks.
- Save a copy for each year to build a history of performance.
Understanding each section of the P&L
Revenue
Revenue is the income earned from selling goods or services. Net revenue is total sales less returns, refunds and discounts. In the sample, net revenue for the year is 6,228,000.
Cost of goods sold
COGS includes the direct costs of producing what you sell, such as raw materials, stock purchases and wages for production staff. It rises and falls with sales volume.
Gross profit
Gross profit equals net revenue minus COGS. It shows how much money is left to cover operating expenses. The gross margin in the sample is 54.9%.
Operating expenses
These are the overheads of running the business, regardless of sales volume: salaries, rent, utilities, marketing, administration and depreciation.
Operating profit (EBIT)
Earnings before interest and tax show how profitable the core business is before financing and tax. In the sample, EBIT is 1,875,000, or 30.1% of revenue.
Net profit
Net profit is what remains after all costs, interest and tax. It can be reinvested in the business, used to repay debt or distributed to owners.
Key profitability ratios
- Gross margin = gross profit ÷ net revenue. It shows pricing power and production efficiency.
- Operating margin = operating profit ÷ net revenue. It shows how well overheads are controlled.
- Net profit margin = net profit ÷ net revenue. It shows overall profitability after all costs.
- Expense ratio = each expense ÷ net revenue. It highlights costs growing faster than sales.
- Quarter-on-quarter growth = (this quarter − last quarter) ÷ last quarter.
Using quarterly columns to spot trends
Quarterly reporting reveals patterns that an annual total hides. In the sample, revenue peaks in Q4, which might reflect seasonal holiday demand, while marketing spending also rises in that quarter. Comparing quarters helps you plan stock, staffing and cash flow for busy and quiet periods, and spot problems early, such as a quarter where costs rose but sales did not. If you prefer monthly reporting, insert additional columns and adjust the full-year formula.
Ways to improve profitability
- Review prices regularly to make sure they cover rising costs.
- Negotiate better terms with suppliers to reduce cost of goods sold.
- Reduce returns and discounts by improving product quality and sales processes.
- Track marketing results and cut channels that do not bring customers.
- Control overheads such as subscriptions, utilities and office costs.
- Refinance expensive loans to lower interest expense.
- Focus on your highest-margin products and services.
Profit vs cash flow
A profitable business can still run out of cash. The P&L records revenue when it is earned and expenses when they are incurred, not when cash moves. If customers pay slowly, inventory builds up or loans are repaid, cash can fall even when profit is strong. Use the P&L alongside a cash flow forecast and balance sheet to get a complete picture of financial health.
Common P&L mistakes
- Mixing personal expenses with business expenses.
- Recording loan repayments as expenses; only the interest is an expense.
- Classifying equipment purchases as expenses instead of fixed assets with depreciation.
- Forgetting accrued expenses, such as unpaid bills at period end.
- Counting customer deposits as revenue before the work is delivered.
- Using inconsistent categories from one period to the next.
Who needs a profit and loss statement?
Every business benefits from a P&L, from freelancers and home businesses to shops, restaurants, agencies and manufacturers. Banks usually ask for one with a loan application. Investors review it before investing. Landlords may request one for commercial leases. Most importantly, owners and managers use it to make decisions about pricing, hiring, spending and growth. Preparing a P&L every month or quarter keeps you in control of your finances.
Reading the sample P&L
The sample statement describes a business with healthy and improving results. Net revenue grows from 1,370,000 in Q1 to 1,865,000 in Q4, a rise of more than a third over the year. Cost of goods sold moves in line with sales, keeping gross margin steady at around 55%, which suggests stable pricing and supplier costs. Operating expenses grow more slowly than revenue, so operating profit climbs from 375,000 in Q1 to 617,000 in Q4. After interest, other income and tax at 29%, the business earns a full-year net profit of 1,295,040, a net margin of 20.8%.
When you review your own statement, ask the same questions: Is revenue growing? Are margins stable? Are any expenses growing faster than sales? Which quarter was strongest, and why? The answers point you toward the decisions that matter most for the coming year.
Frequently asked questions
Is this P&L template free?
Yes. Download, edit and use it for your business or for clients.
Can I change the tax rate?
Yes. The income tax rate is an editable input. Enter the rate that applies to your business; tax rules vary by country and business type.
Is a profit and loss statement the same as an income statement?
Yes. The terms are used interchangeably, along with "statement of profit or loss" and "P&L".
Can I use the template monthly?
Yes. Rename the quarter columns to months or insert extra columns and update the full-year formula.
Does this replace an accountant?
No. The template helps you organize and understand your figures, but official accounts and tax returns should be reviewed by a qualified accountant.
What is a good net profit margin?
It depends on the industry. Retail and food businesses often earn low single-digit margins, while software and professional services can earn much higher margins. Compare your figures with businesses in your sector and with your own previous years.
Should depreciation be included?
Yes. Depreciation spreads the cost of equipment and other fixed assets over their useful life, giving a fairer picture of profit each period.
Related templates
- General ledger templates
- Sales report templates
- Cost-benefit analysis template
- Executive summary templates
- Weekly marketing report templates