Should we buy the new system? Hire another person? Open a second location? Every major business decision comes down to the same question: will the benefits outweigh the costs? A cost benefit analysis answers that question with numbers instead of gut feeling. Our free cost benefit analysis template for Excel helps you list costs and benefits over five years, apply a discount rate and automatically calculate net present value, benefit-cost ratio, return on investment and a clear recommendation.
Preview the template below, download the editable XLSX file, and learn how to perform a cost benefit analysis step by step.
Download the free cost benefit analysis template
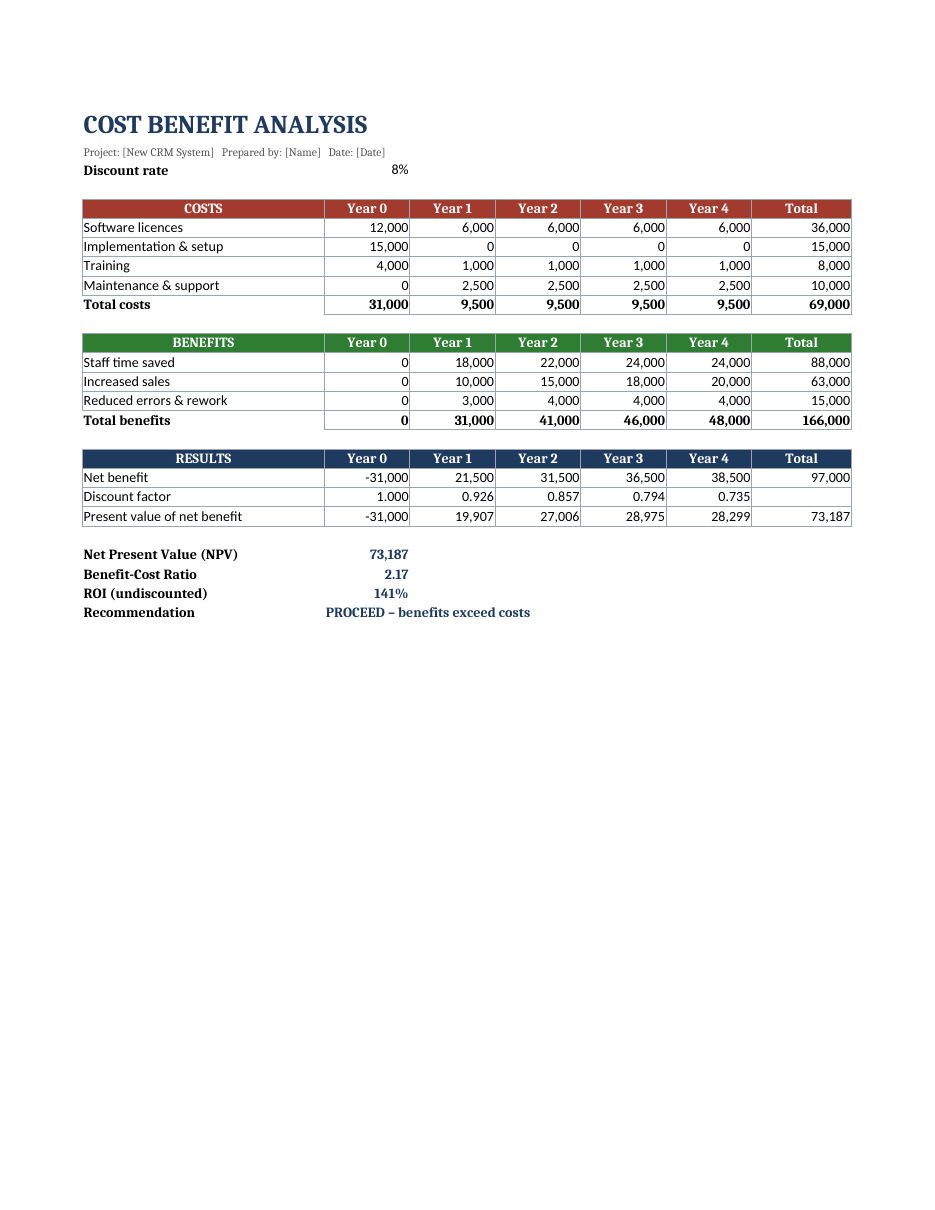
The template works in Microsoft Excel, LibreOffice Calc and Google Sheets. All formulas are unlocked, so you can add rows, change the time horizon or adjust the discount rate.
What is a cost benefit analysis?
A cost benefit analysis (CBA) is a systematic method for comparing the total expected costs of a decision with its total expected benefits. Costs and benefits are expressed in money and spread over the life of the project. Because money received in the future is worth less than money today, a proper CBA discounts future values to their present value. If the present value of benefits exceeds the present value of costs, the project creates value and is generally worth pursuing. Businesses, governments and non-profits use CBA to evaluate investments, policies, projects and purchases.
Features of this CBA template
- Project header with name, preparer and date.
- Adjustable discount rate cell.
- Costs table with five years (Year 0 to Year 4) and automatic totals.
- Benefits table with automatic totals.
- Net benefit for each year.
- Automatic discount factors and present values.
- Net present value (NPV) calculation.
- Benefit-cost ratio based on discounted values.
- Undiscounted return on investment (ROI).
- An automatic recommendation that reads "Proceed" when NPV is positive and "Reconsider" when it is negative.
- Colour-coded sections: red for costs, green for benefits and navy for results.
How to perform a cost benefit analysis step by step
- Define the decision. Describe the project or option clearly, for example "Implement a new CRM system".
- Set the time horizon, usually the expected life of the investment. The template uses five years.
- List all costs, including one-time costs such as purchase, setup and training, and recurring costs such as licences, maintenance and staff time.
- List all benefits, such as time saved, increased sales, lower costs, fewer errors and avoided risks.
- Assign monetary values. Use quotes, historical data, salaries and conservative estimates.
- Place each cost and benefit in the year it occurs. Year 0 represents the start of the project.
- Choose a discount rate that reflects your cost of capital or required return, often between 5% and 12% for businesses.
- Review the results: NPV, benefit-cost ratio and ROI.
- Test sensitivity by changing key assumptions and seeing whether the recommendation changes.
- Document assumptions and present the findings to decision makers.
Understanding the results
Net present value (NPV)
NPV is the sum of each year's net benefit multiplied by its discount factor. A positive NPV means the project is expected to create value after accounting for the time value of money.
Benefit-cost ratio (BCR)
BCR is the present value of benefits divided by the present value of costs. A ratio above 1.0 means benefits exceed costs; a ratio of 2.0 means every unit of cost returns two units of benefit.
Return on investment (ROI)
ROI here is total benefits minus total costs, divided by total costs, without discounting. It is easy to communicate but ignores timing, so use it alongside NPV.
Discount factor
The discount factor for each year is 1 divided by (1 plus the discount rate) raised to the number of years. It converts future amounts into today's money.
Worked example: new CRM system
The sample analysis evaluates a new customer relationship management system. Year 0 costs include software licences, implementation and training, totalling 31,000. Ongoing costs of 9,500 per year cover licences, training and support. Benefits begin in year one, from staff time saved, increased sales and fewer errors, growing from 31,000 to 48,000 per year. Over five years, total benefits of 166,000 exceed total costs of 69,000. With an 8% discount rate, the NPV is about 73,000, the benefit-cost ratio is 2.17 and the undiscounted ROI is 141%, so the template recommends proceeding.
Identifying costs and benefits
Direct and indirect costs
Direct costs are clearly linked to the project, such as equipment and licences. Indirect costs include overheads, management time and temporary productivity loss during implementation.
Tangible and intangible benefits
Tangible benefits, such as higher revenue or lower costs, are easy to measure. Intangible benefits, such as employee satisfaction, customer experience or brand reputation, are harder to value but can be estimated or described qualitatively alongside the numbers.
Opportunity costs
Consider what else you could do with the money or time. If an alternative investment would return more, it should be part of the decision.
Tips for a reliable cost benefit analysis
- Be conservative: underestimate benefits and overestimate costs.
- Include every significant cost, including training and change management.
- Use realistic timing; benefits often start later than expected.
- Document the source of every figure.
- Compare several options, including doing nothing.
- Run best-case, expected and worst-case scenarios.
- Involve finance and operations teams to check assumptions.
- Present results clearly, with a short summary of risks and non-financial factors.
Sensitivity analysis
Small changes in assumptions can have a large impact on results. Copy the sheet and adjust key inputs, such as reducing benefits by 20%, increasing costs by 10% or raising the discount rate, to see whether NPV remains positive. If the recommendation holds under pessimistic assumptions, you can be confident in the decision. If it flips, focus on reducing uncertainty in those assumptions before committing.
When to use a cost benefit analysis
- Buying new equipment, software or vehicles.
- Hiring additional staff or outsourcing.
- Launching a new product or entering a new market.
- Investing in energy efficiency or sustainability projects.
- Evaluating marketing campaigns.
- Comparing make-or-buy decisions.
- Public sector policies and infrastructure projects.
- Personal decisions such as further education or buying versus renting.
Customizing the template
Add cost or benefit rows by inserting them within each table; the totals extend automatically if you insert above the total row. To extend the analysis to ten years, add columns and copy the formulas across, then update the total, NPV and BCR ranges. Change the currency under Format Cells. If you compare several options, copy the sheet once per option and create a summary sheet showing NPV, BCR and ROI side by side.
Cost benefit analysis vs. other decision tools
A cost benefit analysis is one of several tools for evaluating decisions. Break-even analysis tells you how long it takes for benefits to repay the initial investment, which is useful when cash flow matters. Payback period is a simpler version that ignores the time value of money. Internal rate of return (IRR) calculates the discount rate at which NPV equals zero, making it easy to compare against your cost of capital. A SWOT analysis captures strengths, weaknesses, opportunities and threats, including non-financial factors. Cost-effectiveness analysis compares options that achieve the same outcome at different costs. For most business decisions, a CBA with NPV and benefit-cost ratio provides the clearest financial picture, supported by a qualitative review of risks.
Presenting your cost benefit analysis
Decision makers rarely want to read every row of a spreadsheet. Start your presentation with a one-paragraph summary stating the recommendation, the NPV, the benefit-cost ratio and the payback period. Follow with a short table of the main costs and benefits, then list key assumptions and risks. Include the sensitivity results to show how robust the recommendation is. Attach the full workbook as an appendix for anyone who wants to check the detail. A clear, honest presentation builds trust and makes approval more likely.
Frequently asked questions
Is this cost benefit analysis template free?
Yes. Download and use it for unlimited analyses.
What discount rate should I use?
Use your organization's cost of capital or required rate of return. Many businesses use 6% to 10%; public sector analyses often follow a government-specified rate.
What if benefits are hard to quantify?
Estimate them conservatively where possible and describe the rest qualitatively in your report.
Can I use the template in Google Sheets?
Yes. Upload it to Google Drive and open with Google Sheets. All formulas work.
How many years should a cost benefit analysis cover?
Cover the useful life of the investment, typically three to ten years. Software and equipment often use three to five years, while buildings and infrastructure may use twenty years or more. Add columns to the template for longer horizons.
Related templates
Support your decisions with our business plan executive summary template, project plan template, action plan templates, sales report template and general ledger templates.